Menu: Jump to a section
- What Is Technology Addiction?
- What Causes Technology Addiction?
- How Many People Are Addicted to Technology?
- Technology Addiction Statistics
- What Is the Average Daily Time Spent Using the Internet, by Country, Globally?
- What Devices Do People Use to Access the Internet, Globally?
- What Ages and Genders Access the Internet Most?
- Technology Addiction in the USA: Statistics
- How Many People Think They Are Addicted to Technology in the USA?
- Are People in the USA With Technology Addiction Happy or Unhappy?
- Are People in the USA With Technology Addiction Stressed?
- How Much Time Do People Spend on Their Smartphone a Day in the USA (Excluding Voice Calls)?
- How Many People in the US Report Having a Social Media Addiction?
- Does Social Media Have a Positive or Negative Effect on People in the USA?
- Technology Addiction in the UK: Statistics
- How Many UK Teenage Social Media Users Admit to Social Media Addiction?
- How Many People in the UK Have a Smartphone Addiction?
- How Long Do UK Smartphone Owners Spend on Their Phone?
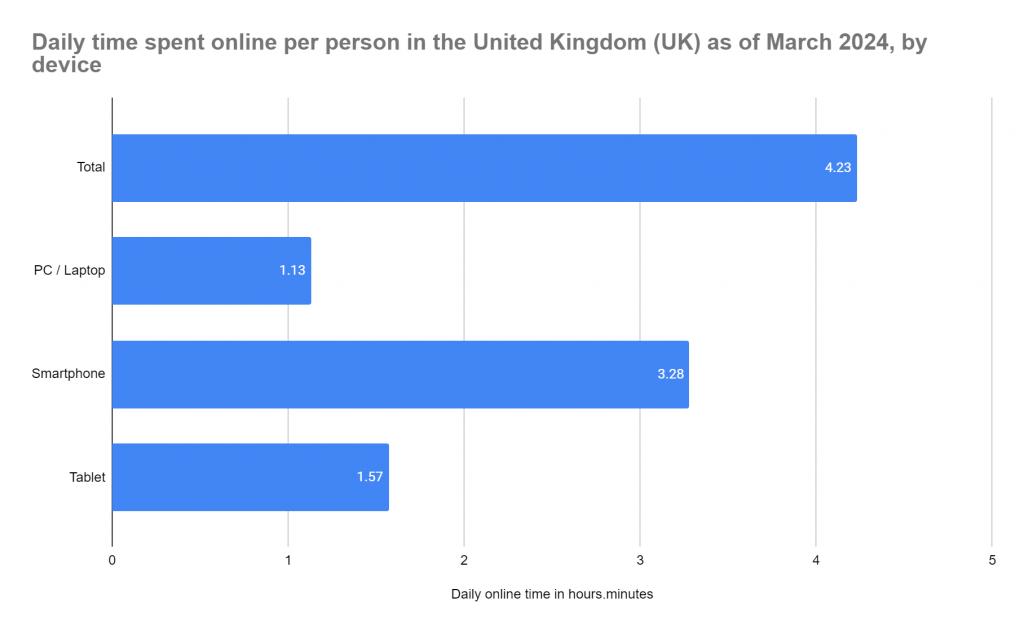
- How Long Do People Spend Online, Daily, in the UK, and What Devices Are They Using?
- Technology Addiction: Canada
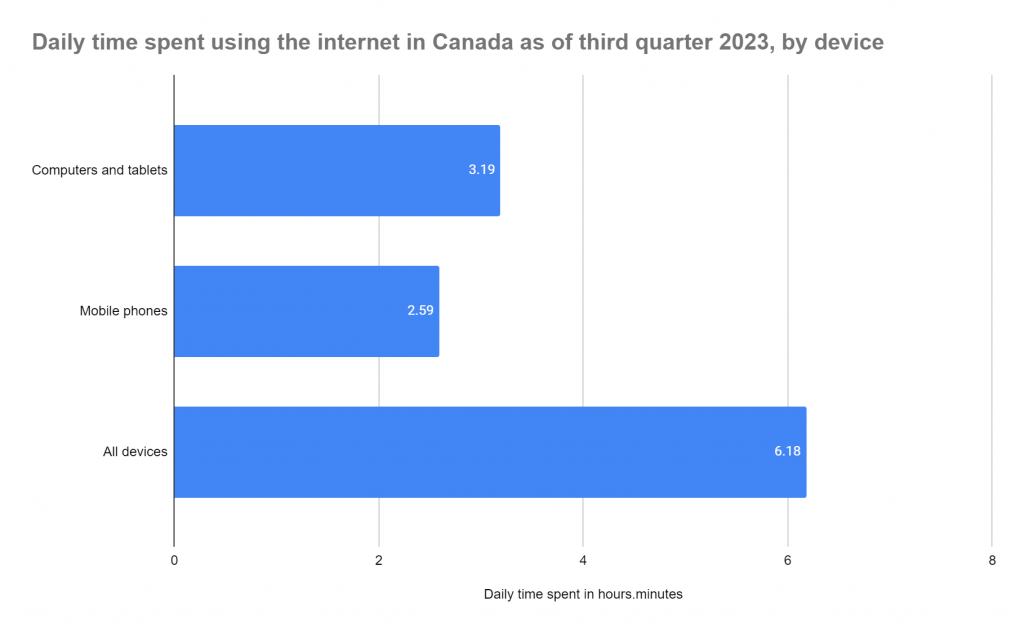
- How Long Do Canadians Spend on the Internet Each Day, by Device?
- Technology Addiction by Age
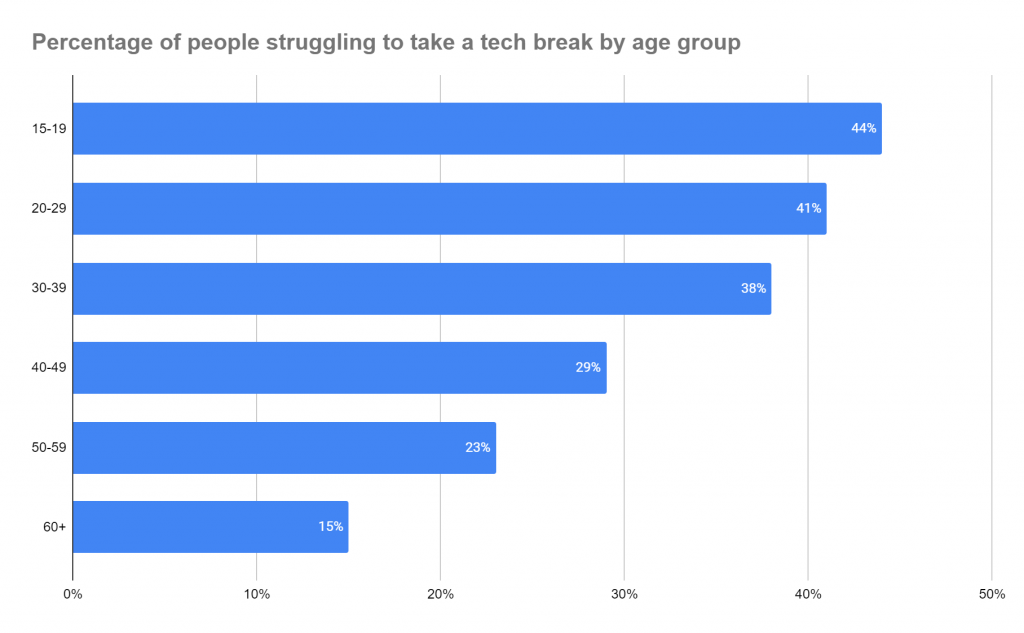
- How Many People Struggle to Take a Break from Tech, by Age?
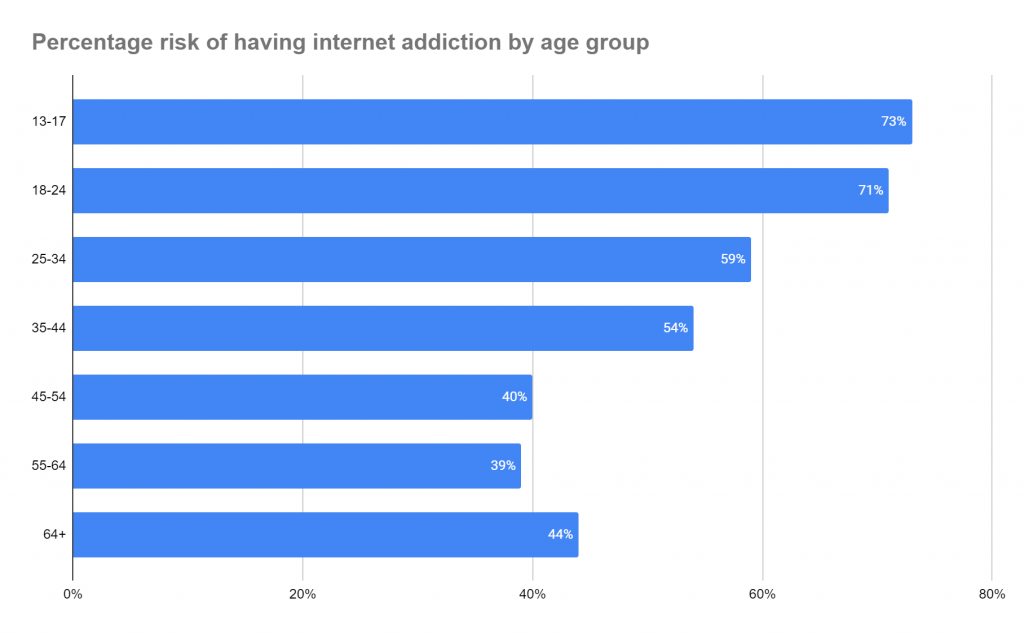
- How Many People Are at Risk of Addiction to the Internet?
- How Can You Prevent Technology Addiction?
- Smartphone Addiction Statistics
- What Is Smartphone Addiction?
- What Are Some Statistics Surrounding Cell Phone Usage?
- How Do Phones Affect Mental Health?
- How Many Hours on Your Phone Counts as an Addiction?
- Technology Addiction, Defined
In this article, we will look at statistics and definitions surrounding technology addiction.. People don’t just become addicted to their smartphone; we can become addicted to any form of technology, from video games, through to social media, and even just the internet in general.
This article will give various statistics around technology addiction. Where is technology addiction most prevalent? What causes technology addiction? How many people are addicted to technology? SellCell will answer all of these questions and more, here. Without further ado, let’s take a look at facts and figures surrounding technology addiction.
What Is Technology Addiction?
In order to define technology addiction, we first need to define the word “addiction”. The Miriam Webster dictionary defines addiction as:
… a compulsive, chronic, physiological or psychological need for a habit-forming substance, behavior, or activity having harmful physical, psychological, or social effects and typically causing well-defined symptoms (such as anxiety, irritability, tremors, or nausea) upon withdrawal or abstinence.
So, in the case of technology addiction, we can define it as a “compulsive, chronic, physiological, or psychological need” for technological devices, platforms, services, or just about anything else powered by tech.
Sandstone Care goes further, saying:
Technology addiction falls into a category of addiction termed behavioral addictions. Behavioral addictions are widely recognized by mental health and addiction professionals and include other behaviors, such as gambling and sex.
A behavioral addiction is characterized by a progressive inability to control, regulate, or limit the behavior. Technology addiction also shares similarities with obsessive-compulsive disorders.
So, what we are saying here is that a person who has an addiction to technology, no matter what that device (or those devices or services) might be, is addicted as they cannot control their use of their devices.
Sources
Miriam Webster Dictionary
Sandstone Care
What Causes Technology Addiction?
Now that we know what technology addiction is, we can look at what causes it. According to Healthline, there is no specific cause for technology addiction. This is possibly because technology addiction is so multifaceted, but it could also be because there are numerous reasons why a person may become addicted to technology, in whatever form that may take. Healthline says the following could cause an addiction to technology:
- underlying mental health conditions, including anxiety and depression
- genetics
- environmental factors
However, there can be further reasons for a person’s addiction to tech. One such reason is almost certainly how our body produces dopamine. Dopamine is a neurotransmitter that our body produces naturally. It is responsible for making us feel pleasure, motivating us, and assists us with learning. However, too much of a good thing isn’t always good for our bodies and minds, and dopamine is one such double-edged sword. The Recovery Village explains it as follows:
Internet use triggers a sense of reward in the brain that leads to more use. A few people are very sensitive to this effect and it is why the people who go online day-to-day for work or school don’t ever develop signs of an addiction.
Some of the causes of this addiction can include using the internet too much as a kid and not having a parent watch online use. People with a recent traumatic event, high stress levels or a substance use disorder all face a high risk of having this type of addiction.
While Recovery Village is talking specifically about internet addiction, the causes and effects are the same across the tech landscape; the thing you are addicted to doesn’t really make a difference in this sense. The “sense of reward” that Recovery Village is talking about here is that which dopamine produces.
So, what actually causes technology addiction? A predisposition to enjoy what you eventually become addicted to is the first step. If you enjoy it, your body produces dopamine. You will then chase that dopamine production. Those addicted will continue to chase the dopamine high. Really, then, is it the technology we are addicted to, or the dopamine it produces?
Society itself could also play a role in our addiction to technology. We rely a lot on our smartphones to communicate with each other. With a device in our hands at all times, it seems natural that we would form a dependence on our devices (and not just limited to smartphones). We collectively fear missing out, exclusion from social groups, and we succumb to peer pressure. All of this can lead to a reliance on technology as we attempt to navigate our position in society, and interact with one-another via modern technology.
Sources
Healthline
Recovery Village
How Many People Are Addicted to Technology?
The number of people addicted to technology is growing day-by-day. People are addicted to multiple forms of technology, such as the internet, video games, social media, TV… the list goes on. With so many devices and platforms, the number of tech addicts is only going to increase as time goes on.
Addiction Help states that “according to research from the University of Michigan, an estimated 210 million people worldwide suffer from addiction to social media and the internet.” This only takes into account internet and social media addiction, though; it doesn’t account for those addicted to video games or other forms of technology.
In addition, Addiction Help states that 56.8% of the global population are active on social media—whichever platform they use. This can only mean one thing; the number of technology addicts is going to grow as more users join these platforms.
A study by Li YY et al, published in the American Journal of Addictions, suggests that the COVID pandemic may be responsible for an increase in internet addiction. This potentially extends to other forms of technology as well, although the study only looks at internet use. The study states:
The COVID‐19 pandemic adversely impacted Internet use and increased the prevalence and severity of Internet addiction among the general population in China, especially in vulnerable populations.
While the study looks at the Chinese population, the entire world was in the same position during the COVID pandemic. Everyone endured lockdowns of varying degrees, and with so many people furloughed from work, individuals needed to fill their time. A lot of people turned to tech.
Use of the internet, video games, social media, and streaming services like Netflix and Amazon Prime rose significantly during the pandemic. This will naturally lead to addiction, as people are relying on these devices and platforms to connect with the world around them, as doing so in person was not possible during lockdown.
Numerically, what are we looking at in terms of how many people have a tech addiction? In 2022, a study by Ming et al showed the following, from a pool of 2,123,762 individuals from 64 different countries:
- 26.99% of the global population has a smartphone addiction.
- 17.42% of the world population has a social media addiction.
- 14.22% of the global population has an internet addiction.
- 8.23% of the world population has a cybersex addiction.
- 6.04% of the global population has a gaming addiction.
We should note that some of these addictions may well co-exist, and almost certainly will contribute to additional addictions. For example, we could say a person who uses their smartphone to feed their social media addiction could also have a smartphone addiction. Or someone with a cybersex addiction might also have an internet addiction, if that is the channel they use to access their content.
Sources
Addiction Help
American Journal of Addictions (National Library of Medicine)
Clinical Psychology Review
Technology Addiction Statistics
We know what tech addiction is, what causes it, and how many people globally show addictive traits when it comes to their tech. Now, we will look at the stats surrounding technology addiction, starting with global statistics.
What Is the Average Daily Time Spent Using the Internet, by Country, Globally?
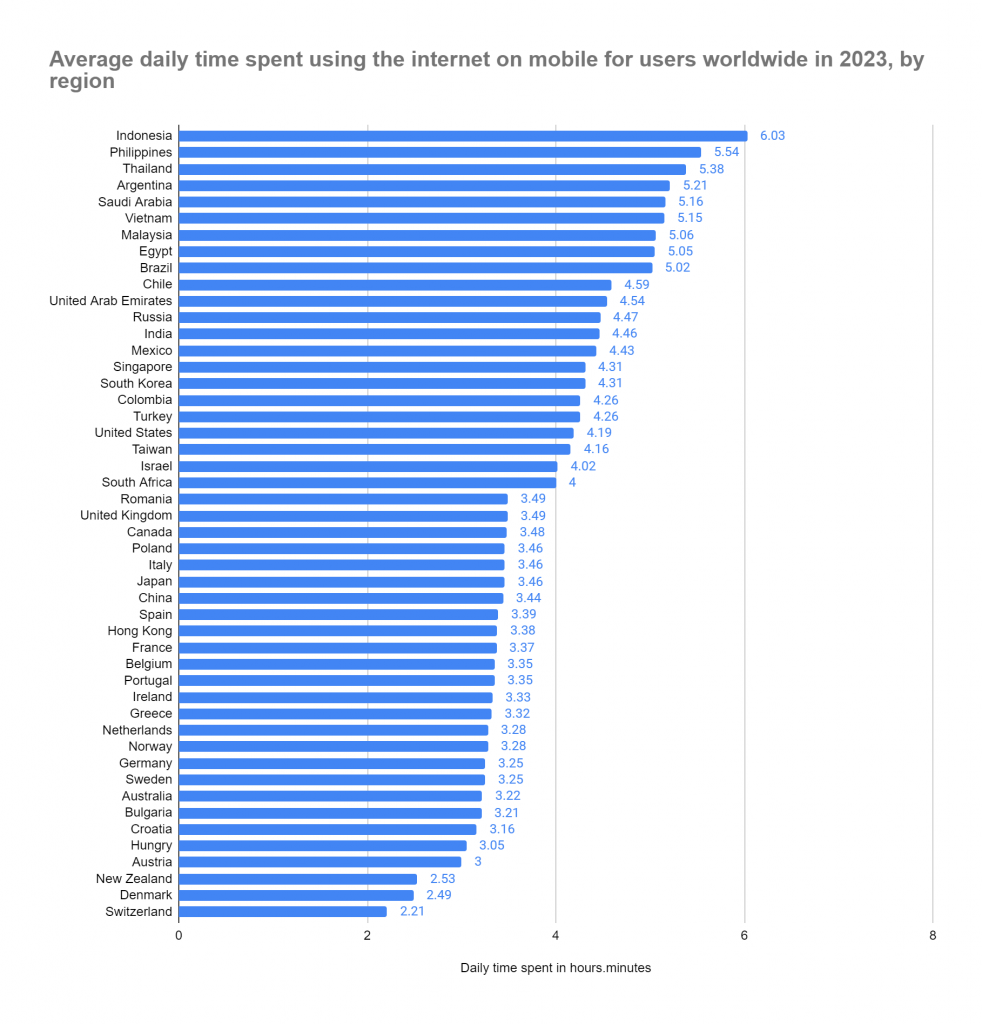
| Average daily time spent using the internet on mobile for users worldwide in 2023, by region | |
|---|---|
| Daily time spent in hours.minutes | |
| Indonesia | 6.03 |
| Philippines | 5.54 |
| Thailand | 5.38 |
| Argentina | 5.21 |
| Saudi Arabia | 5.16 |
| Vietnam | 5.15 |
| Malaysia | 5.06 |
| Egypt | 5.05 |
| Brazil | 5.02 |
| Chile | 4.59 |
| United Arab Emirates | 4.54 |
| Russia | 4.47 |
| India | 4.46 |
| Mexico | 4.43 |
| Singapore | 4.31 |
| South Korea | 4.31 |
| Colombia | 4.26 |
| Turkey | 4.26 |
| United States | 4.19 |
| Taiwan | 4.16 |
| Israel | 4.02 |
| South Africa | 4 |
| Romania | 3.49 |
| United Kingdom | 3.49 |
| Canada | 3.48 |
| Poland | 3.46 |
| Italy | 3.46 |
| Japan | 3.46 |
| China | 3.44 |
| Spain | 3.39 |
| Hong Kong | 3.38 |
| France | 3.37 |
| Belgium | 3.35 |
| Portugal | 3.35 |
| Ireland | 3.33 |
| Greece | 3.32 |
| Netherlands | 3.28 |
| Norway | 3.28 |
| Germany | 3.25 |
| Sweden | 3.25 |
| Australia | 3.22 |
| Bulgaria | 3.21 |
| Croatia | 3.16 |
| Hungry | 3.05 |
| Austria | 3 |
| New Zealand | 2.53 |
| Denmark | 2.49 |
| Switzerland | 2.21 |
- As the chart above shows, Indonesia holds the record for the most time spent on mobile internet every day. On average, an Indonesian spends 6.03 hours scrolling through mobile web pages.
- The Philippines comes a not-too-distant second, with the average mobile internet time being 5.54 hours.
- In third place is Thailand, with an average of 5.38 hours on mobile internet.
- The USA averages 4.19 hours of mobile internet use per person.
- The United Kingdom spends an average of 3.49 hours surfing the mobile web.
Source
Statista
What Devices Do People Use to Access the Internet, Globally?
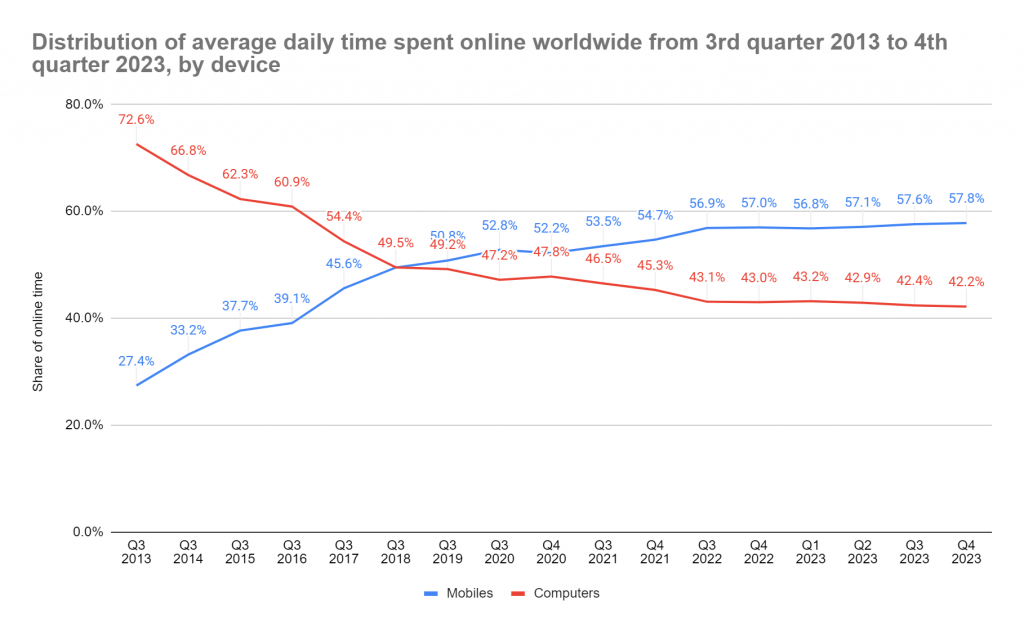
| Distribution of average daily time spent online worldwide from 3rd quarter 2013 to 4th quarter 2023, by device | ||
|---|---|---|
| Mobiles | Computers | |
| Q3 2013 | 27.4% | 72.6% |
| Q3 2014 | 33.2% | 66.8% |
| Q3 2015 | 37.7% | 62.3% |
| Q3 2016 | 39.1% | 60.9% |
| Q3 2017 | 45.6% | 54.4% |
| Q3 2018 | 49.5% | 49.5% |
| Q3 2019 | 50.8% | 49.2% |
| Q3 2020 | 52.8% | 47.2% |
| Q4 2020 | 52.2% | 47.8% |
| Q3 2021 | 53.5% | 46.5% |
| Q4 2021 | 54.7% | 45.3% |
| Q3 2022 | 56.9% | 43.1% |
| Q4 2022 | 57.0% | 43.0% |
| Q1 2023 | 56.8% | 43.2% |
| Q2 2023 | 57.1% | 42.9% |
| Q3 2023 | 57.6% | 42.4% |
| Q4 2023 | 57.8% | 42.2% |
- As one might expect, in Q3 of 2013 more people (72.6%) were accessing the internet via a computer, than they were on a mobile phone (27.4%). This makes sense, as mobile internet was less developed in 2013 than it is in 2024.
- In Q3 2018, we saw the two platforms evening out, with 49.5% of people using a computer for internet access, and 50.5% of people using a phone.
- By Q4 2023, we can see that smartphones have taken the lead. 57.8% of people use their phone to access the internet, vs. 42.2% of people who use a computer. The trends appear to be plateauing at this stage.
Source
Statista
What Ages and Genders Access the Internet Most?
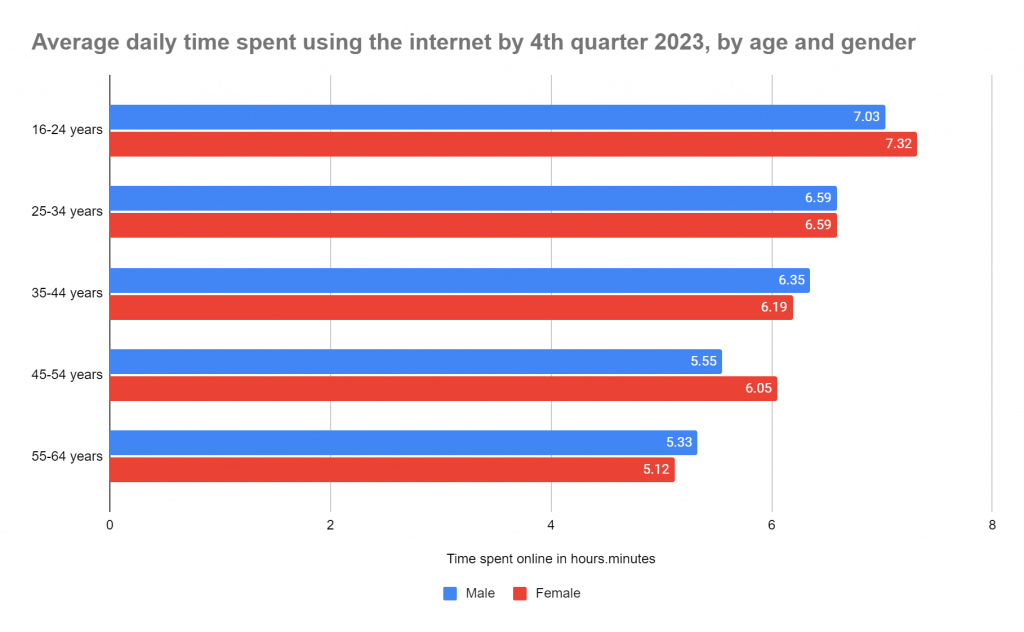
| Average daily time spent using the internet by 4th quarter 2023, by age and gender | ||
|---|---|---|
| Male | Female | |
| 16-24 years | 7.03 | 7.32 |
| 25-34 years | 6.59 | 6.59 |
| 35-44 years | 6.35 | 6.19 |
| 45-54 years | 5.55 | 6.05 |
| 55-64 years | 5.33 | 5.12 |
- In the 16-24 age bracket, females spend more time on the internet each day (7.32 hours) than males do (7.03). This makes sense, as more females in this age bracket use social media apps like TikTok than males do (57% female, 43% male).
- The 25-34 age bracket is neck-and-neck in terms of time spent on the internet. Both males and females in this age group spend 6.59 hours surfing the internet.
- 35-44 year olds are spending less time on the internet than the two preceding age groups. Males spend 6.35 hours on the web, while women spend 6.19 hours.
- Women in the 45-54 age group spend more time on the internet, racking up a solid 6.05 hours. Men in this bracket spend 5.55 hours on it. There is no indication as to why women in this age group spend more time on the internet than men.
- In the 55-64 age bracket, men spend 5.33 hours on the internet, compared to the 5.12 hours women spend accessing the web each day.
Source
Statista
Technology Addiction in the USA: Statistics
We will now look at technology addiction stats in more detail, for territory specific data. We will start with the USA.
How Many People Think They Are Addicted to Technology in the USA?
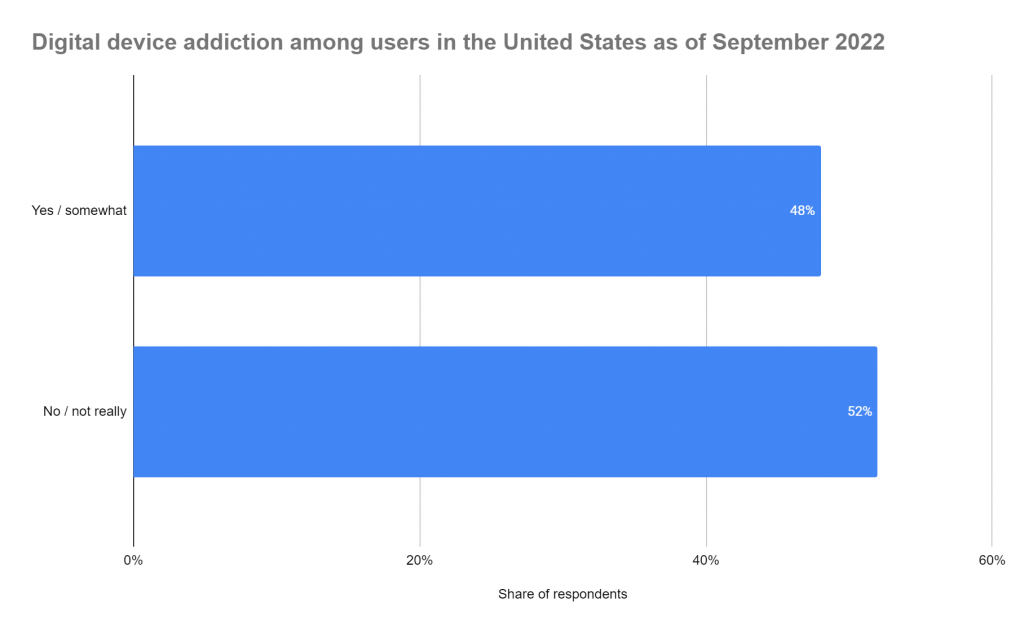
| Digital device addiction among users in the United States as of September 2022 | |
|---|---|
| Percentage | |
| Yes / somewhat | 48% |
| No / not really | 52% |
- As the above data shows, as of September 2022 48% of US citizens admit that they are fully or somewhat addicted to technology.
- This leaves 52% who do not think they have an addiction to technology. As we grow more and more reliant on tech, we may see these numbers change dramatically, with more people admitting to a technology addiction.
- The above figures do not account for people who have a technology addiction but do not recognise the fact.
Source
Statista
Are People in the USA With Technology Addiction Happy or Unhappy?
| Digital device addiction among users in the United States as of September 2022, by happiness level | ||
|---|---|---|
| Very happy / somewhat strongly happy | Not very much happy / at all | |
| Yes / somewhat | 65% | 35% |
| No / not really | 75% | 25% |
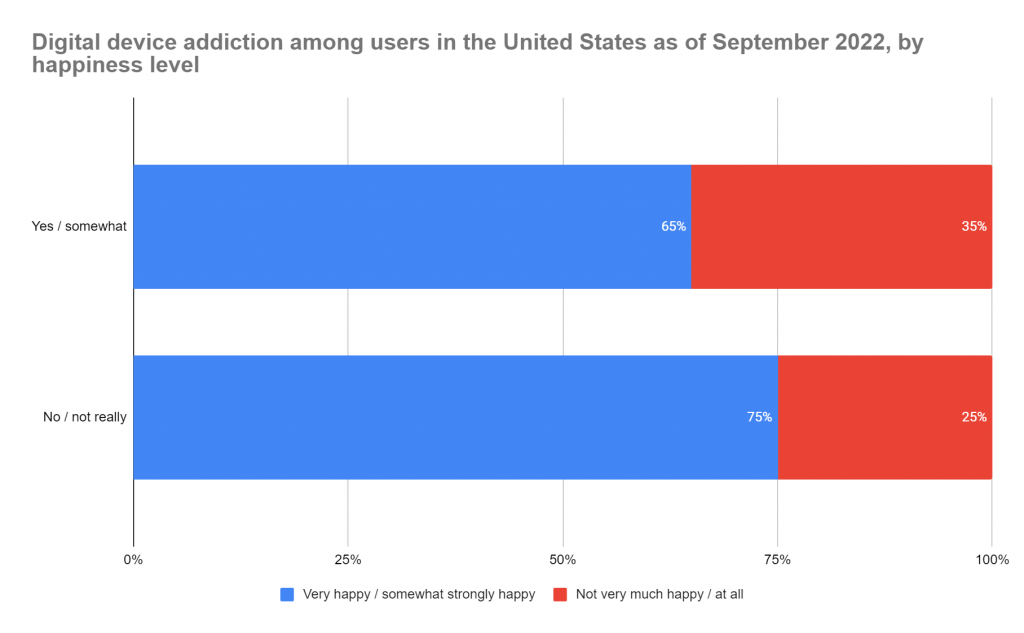
- As of September 2022, of the US citizens who state they have an addiction to digital devices, 65% said they are happy, while 35% said they are not happy.
- Of those who state they do not have an addition to technology, 75% of them are happy, and 25% of them are unhappy.
- The reason those with an addiction to tech perceive themselves as being happy may be down to dopamine levels. As they feed their addiction, they are receiving positive reinforcement from dopamine release.
Source
Statista
Are People in the USA With Technology Addiction Stressed?
| Digital device addiction among users in the United States as of September 2022, by stress level | ||
|---|---|---|
| Very stressed / somewhat strongly stressed | Not very much stressed / at all stressed | |
| Yes / somewhat | 61% | 39% |
| No / not really | 47% | 53% |
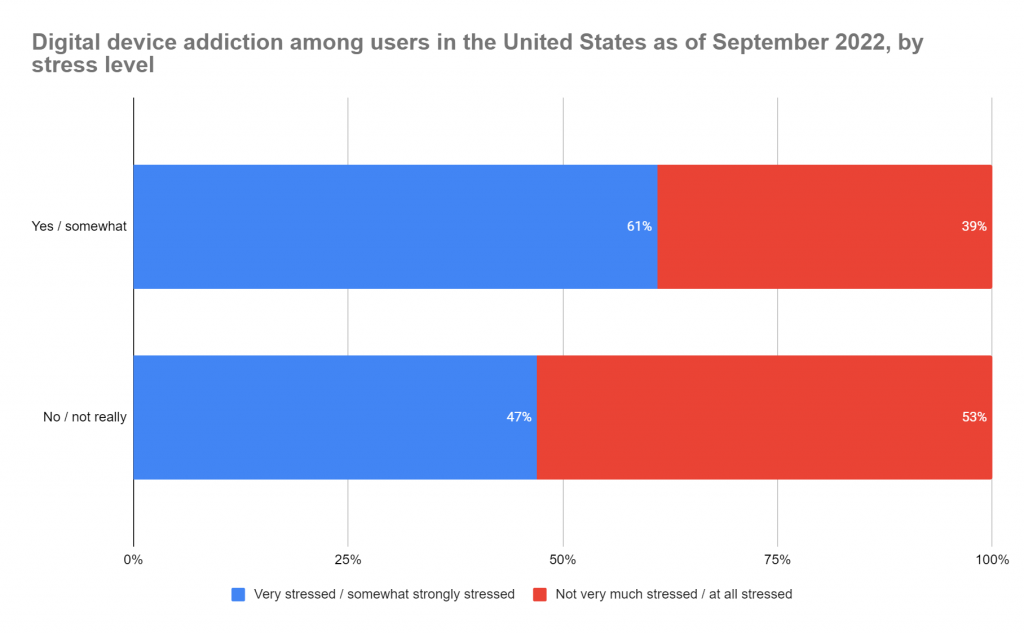
- The data above shows, of those who say they have a digital device addiction, 61% of them report feeling stress, and 39% of them don’t report stress.
- Of those who say they don’t have an addiction to technology, 47% say they feel stress, and 53% who say they do not feel stress.
- Those who are tech addicts could be using technology as a crutch to alleviate stress via dopamine release.
Source
Statista
How Much Time Do People Spend on Their Smartphone a Day in the USA (Excluding Voice Calls)?
| Time spent with nonvoice activities on mobile phones every day in the United States from 2019 to 2024 | |
|---|---|
| Average time per day in minutes | |
| 2019 | 225 |
| 2020 | 256 |
| 2021 | 264 |
| 2022 | 270 |
| *2023 | 276 |
| *2024 | 279 |
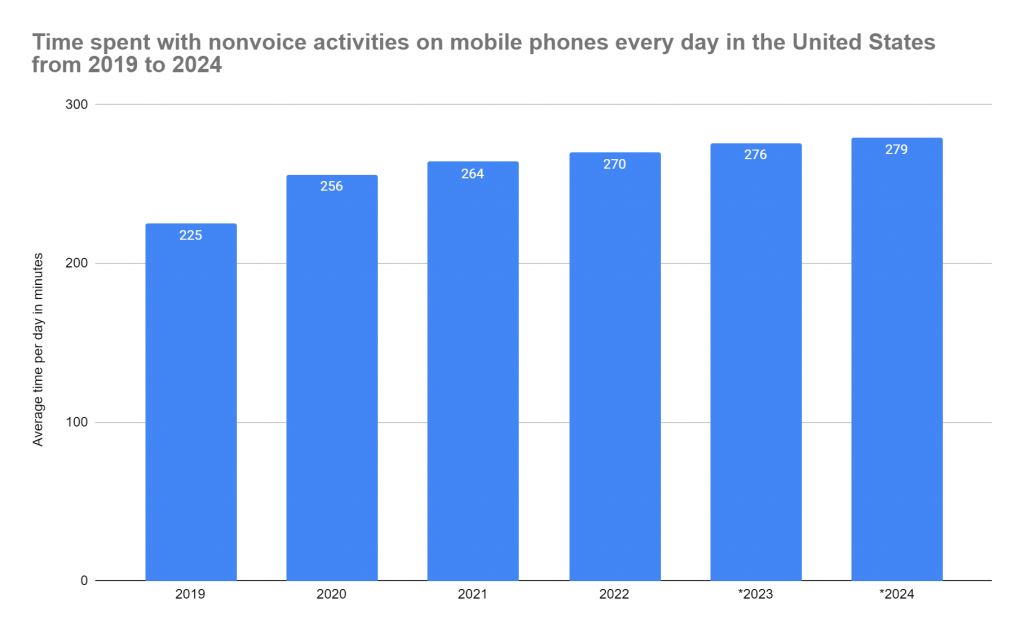
- In 2019, US smartphone owners spent 225 minutes a day on non voice activities on their phone. This would include activities like surfing the web, sending messages, and browsing social media.
- By 2022, this figure has risen to 270 minutes and, by 2024, the time spent on non-voice phone activities is 279 minutes a day.
- The spike in 2020 from 225 minutes (2019) to 256 minutes could be due to the COVID pandemic, and people using their phones more to communicate with people they couldn’t see in person.
Source
Statista
How Many People in the US Report Having a Social Media Addiction?
| Share of online users in the United States who report being addicted to social media as of April 2019, by age group | ||
|---|---|---|
| Describes me completeley | Describes me completely / somewhat | |
| Total | 9% | 30% |
| 18-22 | 5% | 40% |
| 23-38 | 15% | 37% |
| 39-54 | 9% | 26% |
| 55-64 | 1% | 21% |
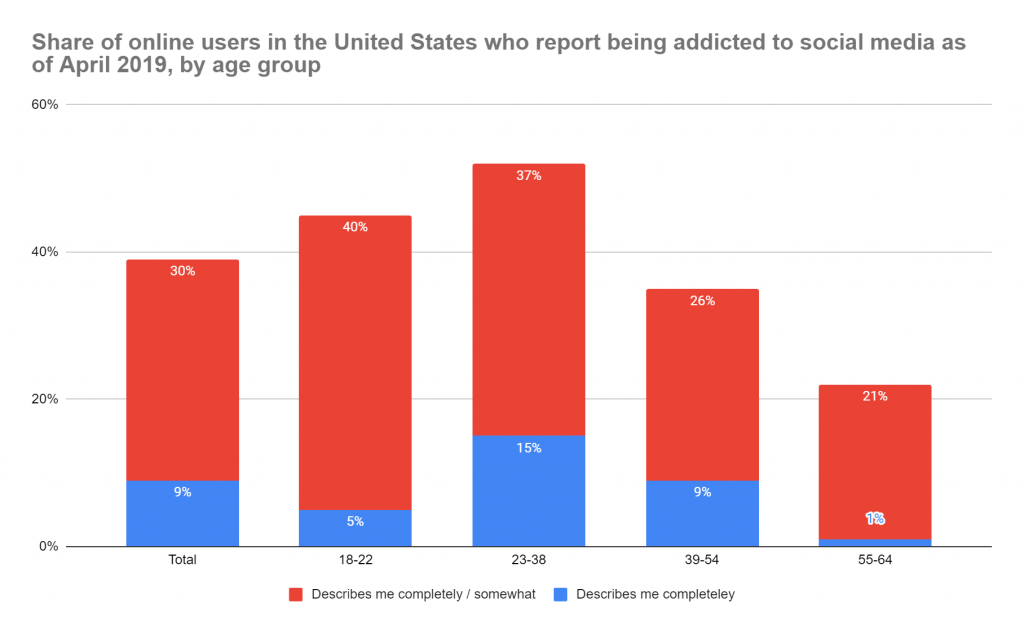
- In total, on average 39% of people in the US state that they have an addiction to social media. 30% say it describes them completely or somewhat, while 9% say it definitely describes them completely.
- In the age group 18-22, 45% report technology addiction, with 40% saying completely or somewhat addicted, and 5% saying they definitely have an addiction to social media and this completely describes them.
- 52% of those in the 25-38 age bracket say they are addicted to social media. 37% of them say they are somewhat or completely addicted, while 15% say they are definitely completely addicted to technology.
- The 39-54 age group features 35% of people who say they are addicted to social media in some way. 26% of them say it describes them completely or somewhat, while 9% say it describes them perfectly and they are completely addicted to social media.
- 22% of people in the 55-64 age group admit some form of social media addiction. 1% of them say they are completely addicted, while 21% of them are unsure and say they are somewhat/completely addicted.
Source
Statista
Does Social Media Have a Positive or Negative Effect on People in the USA?
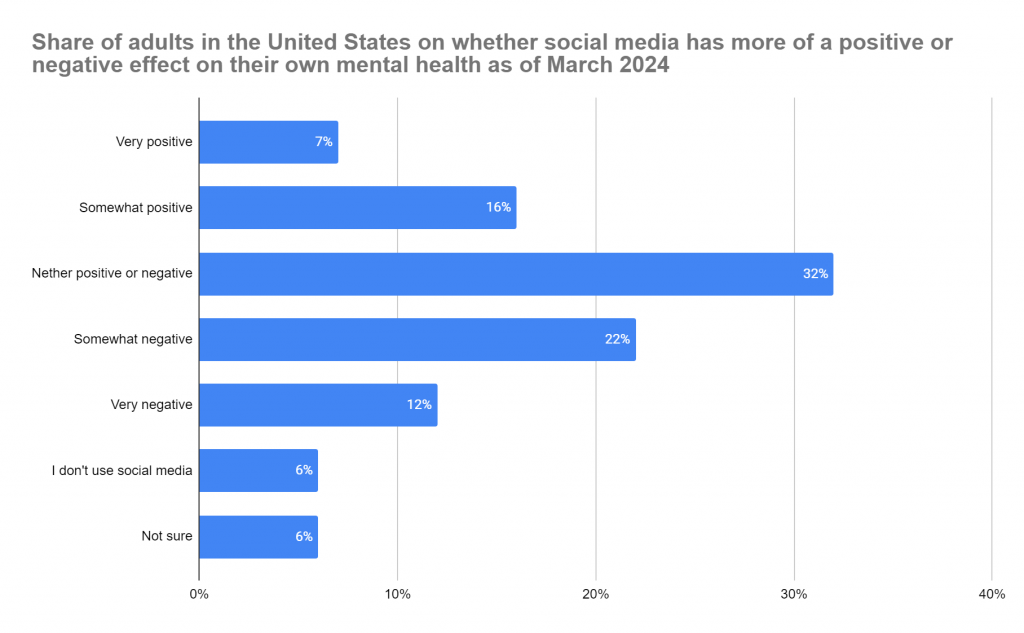
| Share of adults in the United States on whether social media has more of a positive or negative effect on their own mental health as of March 2024 | |
|---|---|
| Percentage | |
| Very positive | 7% |
| Somewhat positive | 16% |
| Nether positive or negative | 32% |
| Somewhat negative | 22% |
| Very negative | 12% |
| I don’t use social media | 6% |
| Not sure | 6% |
- As of March 2024, 7% of US adults say that social media has a “very positive” effect on their mental health, and 16% report a “somewhat positive” effect.
- 32% of social media users say it has neither a positive or negative effect on their mental health.
- 22% say social media has a “somewhat negative” effect on their mental health, while 12% report it having a “very negative” effect on their mental health.
- 6% of people don’t use social media, and 6% aren’t sure what effect it has on their mental health.
Source
Statista
Technology Addiction in the UK: Statistics
We will now look at technology addiction data for the UK, and how technology affects UK citizens.
How Many UK Teenage Social Media Users Admit to Social Media Addiction?
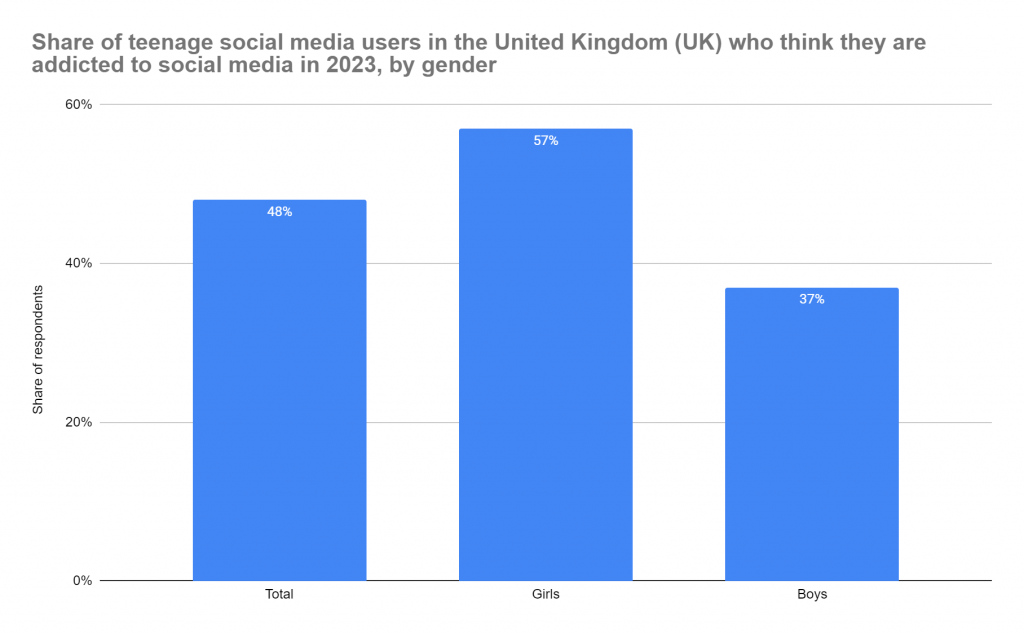
| Share of teenage social media users in the United Kingdom (UK) who think they are addicted to social media in 2023, by gender | |
|---|---|
| Share of respondents | |
| Total | 48% |
| Girls | 57% |
| Boys | 37% |
- In total, as of 2023, 48% of all teenage social media users admit they may have an addiction to social media.
- 57% of female respondents stated they think they have an addiction to social media, while 37% of male respondents report the same.
Source
Statista
How Many People in the UK Have a Smartphone Addiction?
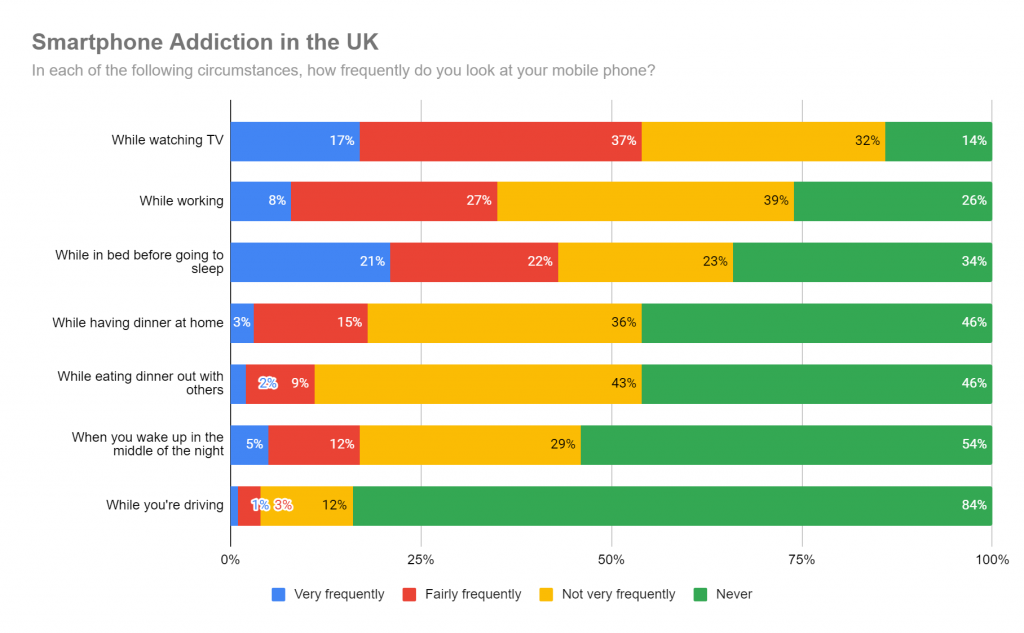
| Smartphone Addiction in the UK In each of the following circumstances, how frequently do you look at your mobile phone? | ||||
|---|---|---|---|---|
| Very frequently | Fairly frequently | Not very frequently | Never | |
| While watching TV | 17% | 37% | 32% | 14% |
| While working | 8% | 27% | 39% | 26% |
| While in bed before going to sleep | 21% | 22% | 23% | 34% |
| While having dinner at home | 3% | 15% | 36% | 46% |
| While eating dinner out with others | 2% | 9% | 43% | 46% |
| When you wake up in the middle of the night | 5% | 12% | 29% | 54% |
| While you’re driving | 1% | 3% | 12% | 84% |
- A YouGov survey in the UK asked participants under what circumstances would they find themselves reaching for their smartphone.
- 17% said they very frequently look at their smartphone while they are already watching the TV. 14% don’t look at their smartphone during a TV session.
- 8% report that they very frequently check their smartphone at work. 27% check it fairly frequently, 39% say not very frequently, and 26% don’t check their smartphone at work.
- Most people (21%) say that they very frequently check their smartphone before bed.
- Most people (84%) thankfully state that they never check their phone while driving. This is a good job, as texting while driving can and does cause serious injury and can result in fatality.
- 3% of people say they very frequently use their phone during dinner at home, and 2% say the same while they are eating out with others (which is why smartphone addiction is ruining our relationships with each other)
- 5% of people check their phone very frequently when they wake up in the middle of the night.
Source
Statista
How Long Do UK Smartphone Owners Spend on Their Phone?
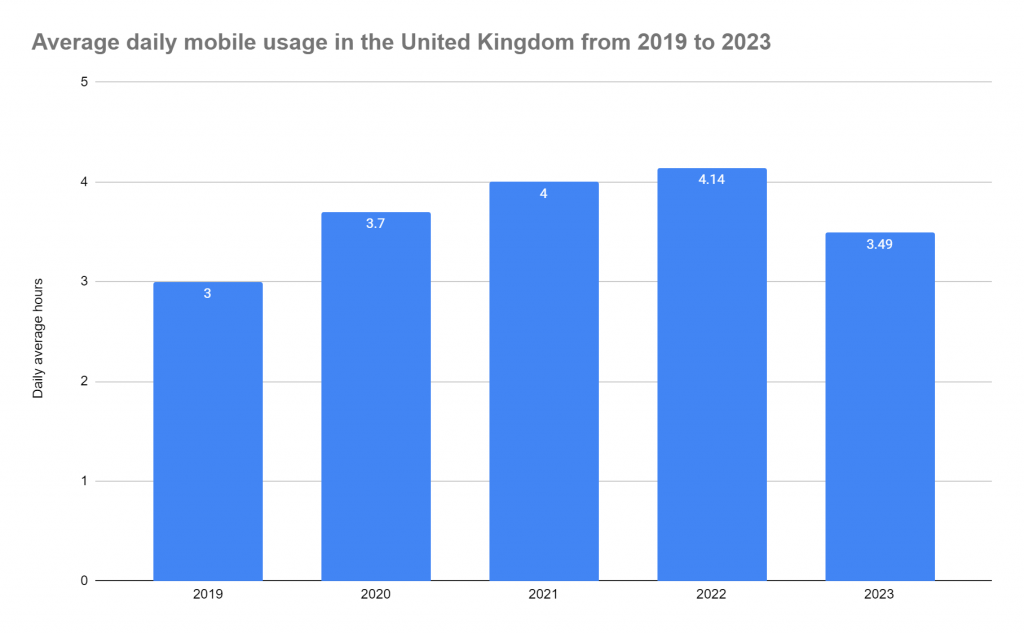
| Average daily mobile usage in the United Kingdom from 2019 to 2023 | |
|---|---|
| Daily average hours | |
| 2019 | 3 |
| 2020 | 3.7 |
| 2021 | 4 |
| 2022 | 4.14 |
| 2023 | 3.49 |
- In 2019, UK smartphone users were spending around 3 hours a day on their mobile phone.
- In 2020, this rose to 3.7 hours, and in 2021 it went up to four hours a day.
- By 2022, smartphone use reached its peak, with 4.14 hours spent on the device on average.
- In 2023, this figure dropped back down to 3.49 hours.
Source
Statista
How Long Do People Spend Online, Daily, in the UK, and What Devices Are They Using?
| Daily time spent online per person in the United Kingdom (UK) as of March 2024, by device | |
|---|---|
| Daily online time in hours.minutes | |
| Total | 4.23 |
| PC / Laptop | 1.13 |
| Smartphone | 3.28 |
| Tablet | 1.57 |
- In total, across all devices, UK internet users spend a total of 4.23 hours online.
- Laptops and PCs carry an average of 1.13 hours of online activity.
- Smartphones lead with 3.28 hours of online activity, illustrating again our addiction to smartphones.
- 1.57 hours of online time comes from tablet use.
Source
Statista
Technology Addiction: Canada
Below, we will briefly discuss data for Canadian technology addiction.
How Long Do Canadians Spend on the Internet Each Day, by Device?
| Daily time spent using the internet in Canada as of third quarter 2023, by device | |
|---|---|
| Daily time spent in hours.minutes | |
| Computers and tablets | 3.19 |
| Mobile phones | 2.59 |
| All devices | 6.18 |
- As of 2023, Canadians spend 3.19 hours using the internet on a computer or a tablet.
- Comparatively, Canadians spend less time each day browsing the internet on their smartphone.
- We can assume, in this case, that less Canadians are addicted to their smartphones than citizens of the USA or the UK.
Source
Statista
Technology Addiction by Age
Younger generations seemingly exhibit technology addiction when compared to older age groups. So, let’s look at some data surrounding technology addiction by age.
How Many People Struggle to Take a Break from Tech, by Age?
| Percentage of people struggling to take a tech break by age group | |
|---|---|
| Percentage | |
| 15-19 | 44% |
| 20-29 | 41% |
| 30-39 | 38% |
| 40-49 | 29% |
| 50-59 | 23% |
| 60+ | 15% |
- 44% of respondents aged 15-19 say they struggle to take a break from technology, and 41% of people aged 20-29 are in the same position.
- 38% of those aged 30-39 admit that they have difficulty pulling themselves away from tech.
- In the 40-49 age bracket, 29% of people say they struggle to come away from their tech for a break.
- Only 23% of those aged 50-59 cannot take a break from tech, and 15% of those aged 60+ also struggle with this.
- The data unequivocally shows that younger generations are more addicted to tech than any other age group.
Source
Headphones Addict
How Many People Are at Risk of Addiction to the Internet?
| Percentage risk of having internet addiction by age group | |
|---|---|
| Percentage | |
| 13-17 | 73% |
| 18-24 | 71% |
| 25-34 | 59% |
| 35-44 | 54% |
| 45-54 | 40% |
| 55-64 | 39% |
| 64+ | 44% |
- The data above shows that an alarming 73% of 13-17 year olds are at risk of forming an addiction to the internet.
- Not far behind is the 18-24 age group, 71% of whom are at risk of internet addiction.
- Those aged 25-34 are slightly less likely to become internet addicts, with 59% at risk.
- In the 35-44 age group, a similar 54% exhibit a likelihood of internet addiction.
- Ages 45-54 and 55-64 are almost level-pegging, with a 40% and 39% likelihood of addiction, respectively.
- 64+ shows a slight increase compared to the previous two generations, with 44% at risk of internet addiction. We can assume this is because a lot of people aged 64+ will be retired, and so will use the internet more often at home.
Source
Compare Camp
How Can You Prevent Technology Addiction?

Fortunately, there are ways we can prevent and even remedy technology addiction. It isn’t something that we cannot avoid. Here are some tips for preventing an addiction to tech, before it even starts.
- Set Time Limits: You can self impose time limits for your technology use. However, even more reliable than your own willpower is using apps or built-in technology features that set daily limits on technology use.
- Create Tech-Free Zones: You could designate certain areas of your home that are “no-go zones” for tech. Stop people using their phone at the dinner table, or prevent the use of tech in bedrooms after a certain time in the evening.
- Schedule Regular Breaks: When you or someone else is using tech, ensure regular breaks in use to come away from the technology in question. A Pomodoro technique is just as applicable to general tech use as it is to carrying out work tasks.
- Engage in Activities Away from Tech: If you find you are using tech so much it is becoming a problem, try to engage in some activities that don’t involve that tech, preferably away from your home so that you aren’t tempted back to your tech.
- Turn Off Notifications: Notifications are not only distracting; they can make you reach for the very piece of tech you are addicted to. Then you have the tech in your hand and the temptation to use it will be strong. Instead, pause or mute notifications so you’re not tempted by your device.
- Try a Digital Detox: Try to commit to specific days or hours per day where you unplug from technology completely. This can be as simple as going for a walk in the park and leaving your smartphone at home while you do.
- Keep an Eye on Tech Use: Try to remain mindful of how often you use your tech and spot trends where you might be overdoing your tech use. Devices like smartphones have handy usage data available so you can see exactly how long you spend on your phone, and what you are spending most time doing on it.
- Set an Example to Children: As we have seen, the younger generations are at a high risk of internet addiction. If you have young children, set a good example by limiting not just their tech use, but also limit your own so they can see it is possible to do so.
- Seek Support: If you feel you have an addiction to technology, seek support from offline services in your local area. Many in-person services exist that can help you break a habit before it becomes a serious problem. Just by going to such a service in person and breaking away from tech is your first step towards ending the cycle of tech addiction.
Smartphone Addiction Statistics
Obviously, smartphone addiction would fall under the umbrella term of “technology addiction”, but it seems that smartphone users are more prone to addiction to their device than any other forms of tech. Here are some definitions and data around smartphone addiction in particular.
What Is Smartphone Addiction?
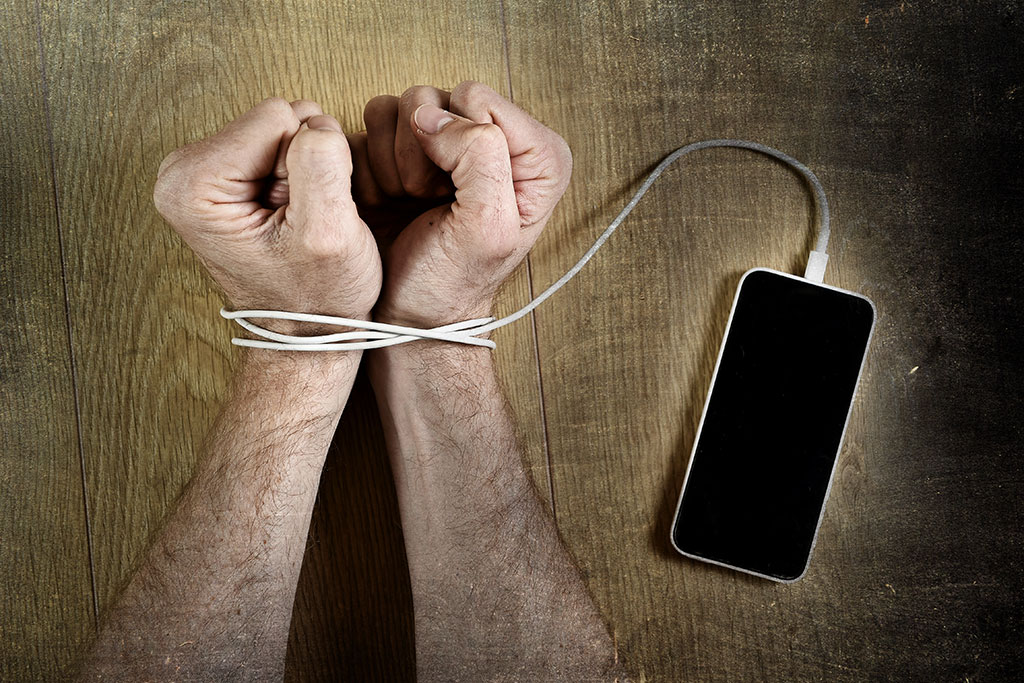
Having defined what an addiction is above, it is simple to define what constitutes a smartphone addiction. We can define smartphone addiction as a habitual overuse of smartphones in a way that it causes disruption in your day-to-day life and your relationships. Addiction Center defines smartphone addiction as the following:
Phone addiction is the obsessive use of a smartphone. The behavioral addiction is often dubbed as “nomophobia,” or the fear of being without a mobile device.
So, it is quite simple to define what a smartphone addiction is and what it might entail. Help Guide goes further by stating what forms smartphone addiction can take. To summarise, it can take the following forms:
- Virtual relationships: an addiction to social media, online chat, forums, dating apps, or messaging apps. If you use these more than interacting with real-world companions, you may well have an addiction to your smartphone.
- Information overload: if someone is compulsively using the internet to absorb all manners of information, to the point it prevents them living a life outside the digital realm, then they may have a smartphone addiction.
- Cybersex addiction: continual access to online pornography sites, adult chat services, adult cam services, or other sexually explicit forms of internet content can all point to a smartphone addiction, especially if the smartphone is the primary gateway to these forms of content.
With so many smartphones in existence, it is no surprise we are becoming addicted to them.
Sources
Addiction Center
Help Guide
What Are Some Statistics Surrounding Cell Phone Usage?

There is a wealth of data around smartphone use that could point towards smartphone addiction and why it occurs.
- An online study by Parasuraman et al. published in the International Journal of Pharmaceutical Investigation stated that, despite being aware of electromagnetic radiation from smartphones, and some respondents reporting physiological issues (hand/wrist strain) from smartphone use, most of the study subjects had developed a smartphone dependency. This proves that smartphone addiction exists; people are willing to ignore the potential issues surrounding smartphone use, in order to be able to use their smartphones.
- According to uSwitch, “in 2022, 86% of people used their mobile to go online, compared to 28% in 2009.” With numbers rising so dramatically, it makes sense that more and more people are becoming addicted to their smartphone.
- uSwitch also states that “as of 2023, half of all nine-year-olds in the UK own a smartphone.” With young people more at risk of forming a smartphone addiction than anyone, this statistic does not bode well for the youngest and most impressionable members of our society.
- Gen Z age-groups are the worst for smartphone use. 75% of individuals in the Gen Z age group claim to spend too much time on their smartphones.
- Teens who spend over five hours a day on their smartphone are 71% more likely to exhibit suicidal tendencies than those who only spend an hour a day on their smartphone.
- The most popular activity that people carry out with their smartphone is chatting and sending messages, with 74.7% of people primarily using their smartphone for this purpose.
- Of the millennial age group, 36% spend two or more hours of their working day looking at their phones, playing mobile games, accessing social media, and messaging their friends on their smartphones.
- 46% of parents in the UK admit that they have some form of smartphone addiction.
- Of those aged 46-55 in the UK, most (20%) cite WhatsApp as the social media app they could not live without.
- 33% of teens spend more time interacting with their smartphones than they do with friends and family in person…
- …and when they are in person with their friends or family, 52% of teens will sit in silence for long periods of time while they attend to their smartphone instead.
- 47% of Americans say that their smartphone is having a negative impact on their mental and emotional wellbeing.
- 51% of Americans also say that their smartphone is having a negative impact on their physical wellbeing.
- 54.7% of smartphone owners state that using their phone causes eye strain.
- 5 years and four months is the total amount of time the average person will spend on social media platforms in their entire life.
- On average, American smartphone users will pick up their phone 352 times a day, if not more.
- 75% of smartphone owners admit that they have texted while driving at least once in their lives.
- 27% of US smartphone owners admit to having sent text messages while at traffic stop lights.
- 48% of people experience nomophobia (the fear of being without a phone) when their battery reaches 20%.
Sources
International Journal of Pharmaceutical Investigation (National Library of Medicine)
uSwitch
Exploding Topics
Slicktext
Statista
Statista
How Do Phones Affect Mental Health?
As the data above shows us, smartphones clearly have an impact on our mental health, and generally this is not a positive impact.
Columbia University Dept of Psychiatry states that smartphones can affect mental health by essentially enabling compulsive use and dependency. Constant notifications can cause anxiety and stress and can even disrupt our sleep.
It goes on to say that social media, while connecting people digitally, can lower self esteem and make us feel worse. This is due to comparison with others and the perceived lives of others, and validation seeking. This can lead to a distorted self-image and even feelings of worthlessness. Heavy use of social media can lead to depression, loneliness, and—at the most extreme—suicidal thoughts.
So, here, Columbia’s researchers are saying that smartphones can have an impact on our mental health, our ability to form meaningful and healthy interpersonal relationships, and can cause depression, anxiety, and loneliness when used to access social media platforms.
Furthermore, smartphone use can lead to one or multiple forms of addiction, which could include Internet Addiction Disorder (IAD, where the user compulsively spends more and more time on the internet to satisfy their dependency), Internet Gaming Disorder (IGD, where the user is unable to take time away from their gaming, resulting in anxiety, anger, or depression), and social media addiction (SMA, where the user neglects social responsibility to engage with online social media instead).
All of these conditions are a direct result of smartphone use and, quite clearly, smartphone use is affecting our mental health negatively.
Sources
Colombia Psychiatry
Better Health
Psychiatry.org
UKAT
How Many Hours on Your Phone Counts as an Addiction?
This is not a question we can answer with a defined time limit. The best way to answer it is to ask whether your smartphone use is having an impact on other aspects of your life. If you are neglecting your real-life relationships due to your smartphone use, the likelihood is you have an addiction to it. Should it be affecting your ability to work, go to school, or enjoy your hobbies, then you are probably addicted to your smartphone. If you need to check your phone compulsively, at risk to your own life (such as when you are driving), then you probably have a smartphone addiction.
The point is, we don’t necessarily measure smartphone addiction temporally. Instead, we should measure it based on how much it interferes with our everyday lives. If we are finding it does interfere, then it is time to reassess our smartphone use and perhaps put measures in place to wean ourselves away from the 6” screen in front of us.
Sources
Helpguide
Technology Addiction, Defined
We now know how technology addiction can affect our wellbeing. This article also demonstrates how many of us actually have an addiction to the tech in our lives, and how it can impact us and the world around us. We have also seen how to prevent potential addiction to technology.
If you or someone you know is a victim of technology addiction, you should seek assistance, or point the tech addict towards services that can help break the cycle, and in turn lead a more fulfilling life away from the constraints of the digital domains we inhabit so frequently.
Our content is created in good faith and reviewed regularly - if you spot an error, please contact corrections@sellcell.com. Read our Editorial Policy
